Real-Time Customer Sentiment Insights with OCI Language

Introduction
Businesses aim to delight their customers, yet problems can arise. By identifying negative customer sentiment as it occurs, businesses can address issues, prioritize support, and improve overall customer satisfaction.
In this solution, Oracle Cloud Infrastructure (OCI) Generative AI and OCI Language are used to analyze customer interactions as they occur in support tickets and emails in an IT service management (ITSM) application. Using advanced natural language processing (NLP) and machine learning, the solution detects sentiment, emotion, and intent, providing early detection of customer dissatisfaction. Sentiment data is then fed to a reporting dashboard, complete with automated alerts that notify the service provider of an issue.
Thanks to Oracle partner DSP for sharing this award-winning solution that delivers on business impact.
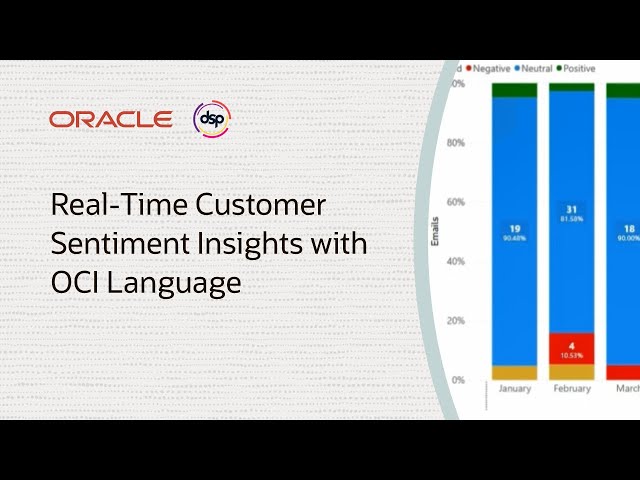
Demo
Block Diagram
 The diagram shows A flowchart titled AI-Powered Sentiment Analysis. Left-to-right process divided into four vertical sections:
 Ticket Application, Data Cleaning, Sentiment Analysis, and Data Visualization.
In the first section, a red and white circular icon represents Cherwell Service Management, with a downward arrow pointing to a blue email icon labeled Emails.
A rightward arrow leads to the Data Cleaning section, which begins with a paper document icon labeled Prompt Message, followed by a downward arrow to a neural chip icon labeled OCI Generative AI, then another downward arrow to a blue speech bubble icon labeled Email body.
A rightward arrow moves into the Sentiment Analysis section, where a chip icon labeled OCI Language is shown above a green-highlighted area labeled Sentiment Analysis.
Another rightward arrow leads to the final section, Data Visualization, where a yellow and orange bar chart icon labeled MS Power BI appears. The arrows between icons indicate the sequential flow of data from email generation to cleaning, analysis, and visualization.
Additional resources
- DSP blog post: Improving Customer Service with AI-Powered Sentiment Analysis
- What Is Generative AI (GenAI)? How Does It Work?
- Sentiment Analysis—documentation
- OCI Language—documentation