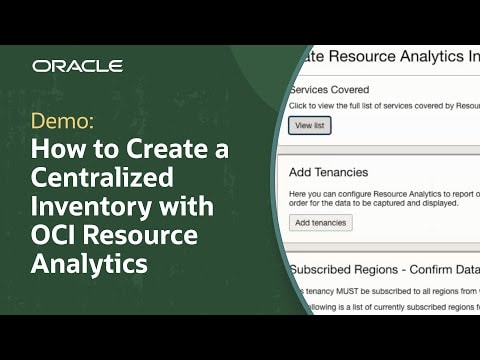
Resource Analytics
Oracle Cloud Infrastructure (OCI) Resource Analytics maintains an up-to-date inventory of OCI resources, their relationships, and configuration metadata. Users can access detailed, near real-time information on monitored resources with SQL queries, graph-based visualizations, and analytics dashboards for enhanced visibility across their IT Infrastructure.
Why choose Resource Analytics?
Multi-tenancy, multi-region resource discovery
Delivers a single, cross-region and cross-tenancy view of resources, strengthening governance and operational oversight.
Relational data model
Benefit from a prebuilt and organized representation of how data is structured and related to each other.
Advanced troubleshooting
Expedites root cause analysis and resolution by mapping resource dependencies and relationships across services.
Ready-to-use analytics
Delivers a suite of service-specific dashboards for instant, actionable visibility across your cloud estate.
Custom reporting and enrichment
Bring your own data and blend it with OCI inventory for richer insights.
Autonomous AI Lakehouse
Provides a foundation for developing advanced AIOps strategies, leveraging integrated analytics and AI-driven operational intelligence across the Oracle ecosystem.
How Resource Analytics works
OCI Resource Analytics is an inventory of OCI resources, their relationships, and configuration metadata. You can access detailed, near real-time information on monitored resources with SQL queries, graph-based visualizations, and analytics dashboards. Resource Analytics provisions an enhanced Autonomous AI Lakehouse and, optionally, an Oracle Analytics Cloud (OAC) instance in your tenancy, letting you import data sets and dashboards to track the inventory, monitor compliance, and troubleshoot any issues. Autonomous AI Lakehouse maintains a best practice relational model of OCI resources, including a property graph that lets you analyze resources and their associations in Graph Studio, and continuously ingests resource updates across the regions and tenancies you specify.

This diagram explains how Oracle Resource Analytics processes and visualizes cloud resource data. The diagram is divided into four vertical sections that flow from left to right:
- OCI Cloud Inventory Metadata: The first section lists various upstream Oracle Cloud resources, represented by icons and text. These include Bare Metal Compute, Block Storage, Database, Backbone (network), and Load Balancer. This signifies the collection of metadata for a range of infrastructure components in Oracle Cloud.
- Prebuilt Data Pipelines: The second section shows automated steps that extract, transform, and load the collected metadata. Five parallel data pipelines are depicted, each carrying resource data forward to the next stage.
- Prebuilt Data Model: In the third section, these pipelines feed into a centralized data warehouse (Autonomous AI Database), visualized using a star schema. The star schema represents how resource information and their relationships are structured for easy analysis and querying.
- Prebuilt Content: In the fourth and final section, two types of content are produced from the data model. The top shows dashboards powered by subject areas for comprehensive reporting and analysis. The bottom illustrates prebuilt resource graph visualizations, which display how resources are related and dependent on each other.
Overall, the diagram describes how Resource Analytics takes resource metadata from various OCI components, processes it through automated data pipelines, organizes it in a relational format within the Autonomous Database, and finally delivers accessible dashboards and interactive graph visualizations for users. This enables organizations to understand, analyze, and visualize their cloud infrastructure in an integrated and streamlined way.
Resource Analytics value propositions
-
Resource discovery
With denormalized views in Autonomous AI Lakehouse and prebuilt dashboards in OAC, customers gain a consolidated view of resources across multiple regions and tenancies, improving governance and oversight. In addition to the unified inventory overview, OAC also offers specialized drill-down dashboards that provide detailed insights into specific resource types, enabling targeted visibility and analysis for your most critical infrastructure components.
-
Advanced troubleshooting
Accelerate root cause analysis and issue resolution by effectively mapping dependencies across resources. Customers can easily access resource properties with a right-click and quickly navigate to the console for immediate actions. The resource graph below visually displays a compute resource and its associated dependencies within a compartment.
-
Governance and compliance
A centralized resource inventory simplifies evidence collection and verification during compliance reviews, supporting regulatory requirements. This consolidated resource inventory and robust policy controls helps you provide ongoing policy monitoring and enforcement.
-
Custom reporting and enrichment
Because Autonomous AI Lakehouse and Oracle Analytics Cloud are deployed within the customer’s tenancy, customers can easily bring in their own datasets and join them with the OCI Resource Analytics schema to create enriched insights. The schema remains protected and read-only, preserving data integrity. For instance, customers have expressed interest in incorporating their internal organization or team metadata, making it possible to identify which teams are responsible for specific data migration activities across their OCI environments.
Get started with Resource Analytics
Contact sales
Interested in learning more about Resource Analytics? Let one of our experts help.
